 Reads your warehouse directly. Read-only.
Ask your database a question. Keep the answer.
Dataki writes the SQL, runs it against your warehouse and draws the chart. Anything worth keeping becomes a live dashboard with a link — not a message that scrolls away.
Read-only connections · your credentials never reach the assistant · every query logged.
An AI analytics platform that queries your database directly and charts the answer inline.
Connect BigQuery, PostgreSQL, MySQL, Amazon Redshift, Supabase or Google Sheets, or upload a file, and ask a question in plain English. Dataki writes the SQL, runs it against your warehouse, and renders the chart beside the answer — with the query on show, so anyone who reads SQL can check the logic. Keep what matters as a live dashboard, or connect Claude, Cursor and ChatGPT through Dataki's MCP server and let them query the same governed sources without ever seeing a credential. Whoever asks, and from wherever, the answer works from the team's own definitions and is kept where the team can find it.
Reads directly from
- BigQuery
- PostgreSQL
- MySQL
- Amazon Redshift
- Supabase
- Google Sheets
- CSV and Excel
- And the rest






01 One question, end to end
Ask in English. Read the SQL. Keep the chart.
The query is never hidden. Every answer arrives with the SQL that produced it, editable, so anyone who reads SQL can check the logic instead of trusting the sentence above it.
More on the assistantWhich channels brought in revenue last quarter?
02 Dashboards
The follow-up doesn't cost you the dashboard.
Open the chat and the dashboard scales rather than disappearing — every widget you were reading is still on screen while you ask about it. Ask for a change and it lands on the board, not in a message you have to scroll back to.
Which plan is actually carrying the growth?
Business. It added $31.4K of the $55.0K gained since June — 57% of net new MRR, from 31% of accounts.
SELECT plan,
       SUM(IF(month = '2025-12-01', mrr, -mrr)) AS added
FROM   billing.mrr_by_month
WHERE  month IN ('2025-06-01', '2025-12-01')
GROUP BY plan ORDER BY added DESCWhich plan is actually carrying the growth?
Business. It added $31.4K of the $55.0K gained since June — 57% of net new MRR, from 31% of accounts.
SELECT plan,
       SUM(IF(month = '2025-12-01', mrr, -mrr)) AS added
FROM   billing.mrr_by_month
WHERE  month IN ('2025-06-01', '2025-12-01')
GROUP BY plan ORDER BY added DESCDrag widgets, resize them, set a date range, add filters, publish a link. The dashboard is a real document — it does not evaporate when the conversation ends.
More on dashboards03 Getting your data in
Point it at the database you already have.
No warehouse to build, no modelling layer to define, no pipeline to schedule. Give Dataki a read-only role and it reads your schema — the same tables your application writes to.
Every source it readsDataki connects with a read-only role and stores the credentials encrypted. They are never sent to the model — it receives your schema, and the query it writes runs on our side.
You might need to whitelist the IP 34.89.253.13.
You might need to whitelist the IP 34.89.253.13.
You might need to whitelist the IP 34.89.253.13.
Turn on Publicly accessible and allow 34.89.253.13/32 on port 5439 in its security group.
Select a project to link it with Dataki for this team. Linking allows Dataki to query datasets within the project.
04 What the model never gets
The model writes the query. It never holds the keys.
Your credentials are encrypted on our side and never enter a prompt. What the model receives is your schema; what runs is SQL, on a read-only role, from our infrastructure. Every query is recorded with the key that ran it and the rows it returned.
How the security model works- The SQL is on show
- Every answer carries the query that produced it, editable. Anyone who reads SQL can check the logic instead of trusting the sentence above it.
- Read-only by construction
- Dataki connects with a role that cannot write. It is not a policy someone has to remember — the connection has no other permission to lose.
- Scoped, revocable keys
- Embed and MCP keys carry their own daily ceilings on queries and bytes scanned, and die the moment you revoke them.
- A log, per query
- The SQL, the row count, the key. If you need to answer what was read and by whom, the answer already exists.
- Your company's sign-in
- Teams on Microsoft Entra ID sign in through their own tenant, under its MFA and access policies. An email address counts only on the domains you name.
The honest version: a trained analyst with Tableau will out-model us on a hard question. The point is that most questions are not hard, and they should not need an analyst. See the full comparisons.
05 Assistants, over MCP
Ask from Claude. Keep it where the team works.
Most teams already ask their own Claude or agent about the numbers. Each answer is a chart in one person's chat, worked out with that person's idea of what revenue means — and a week later nobody can find it, or say what it counted.
Point Claude, Cursor or ChatGPT at Dataki's remote MCP server and they query the same governed sources, under the same key ceilings and audit log, without ever seeing a credential. In Claude, and in any host that draws MCP Apps, the answer comes back as Dataki's own charts — drawn from the rows the query returned, not numbers the model retyped — and one click puts any of them on a dashboard.
Connect an assistant Claude
  Cursor
  ChatGPT
  VS Code
 How did August go, and how has revenue moved this year?
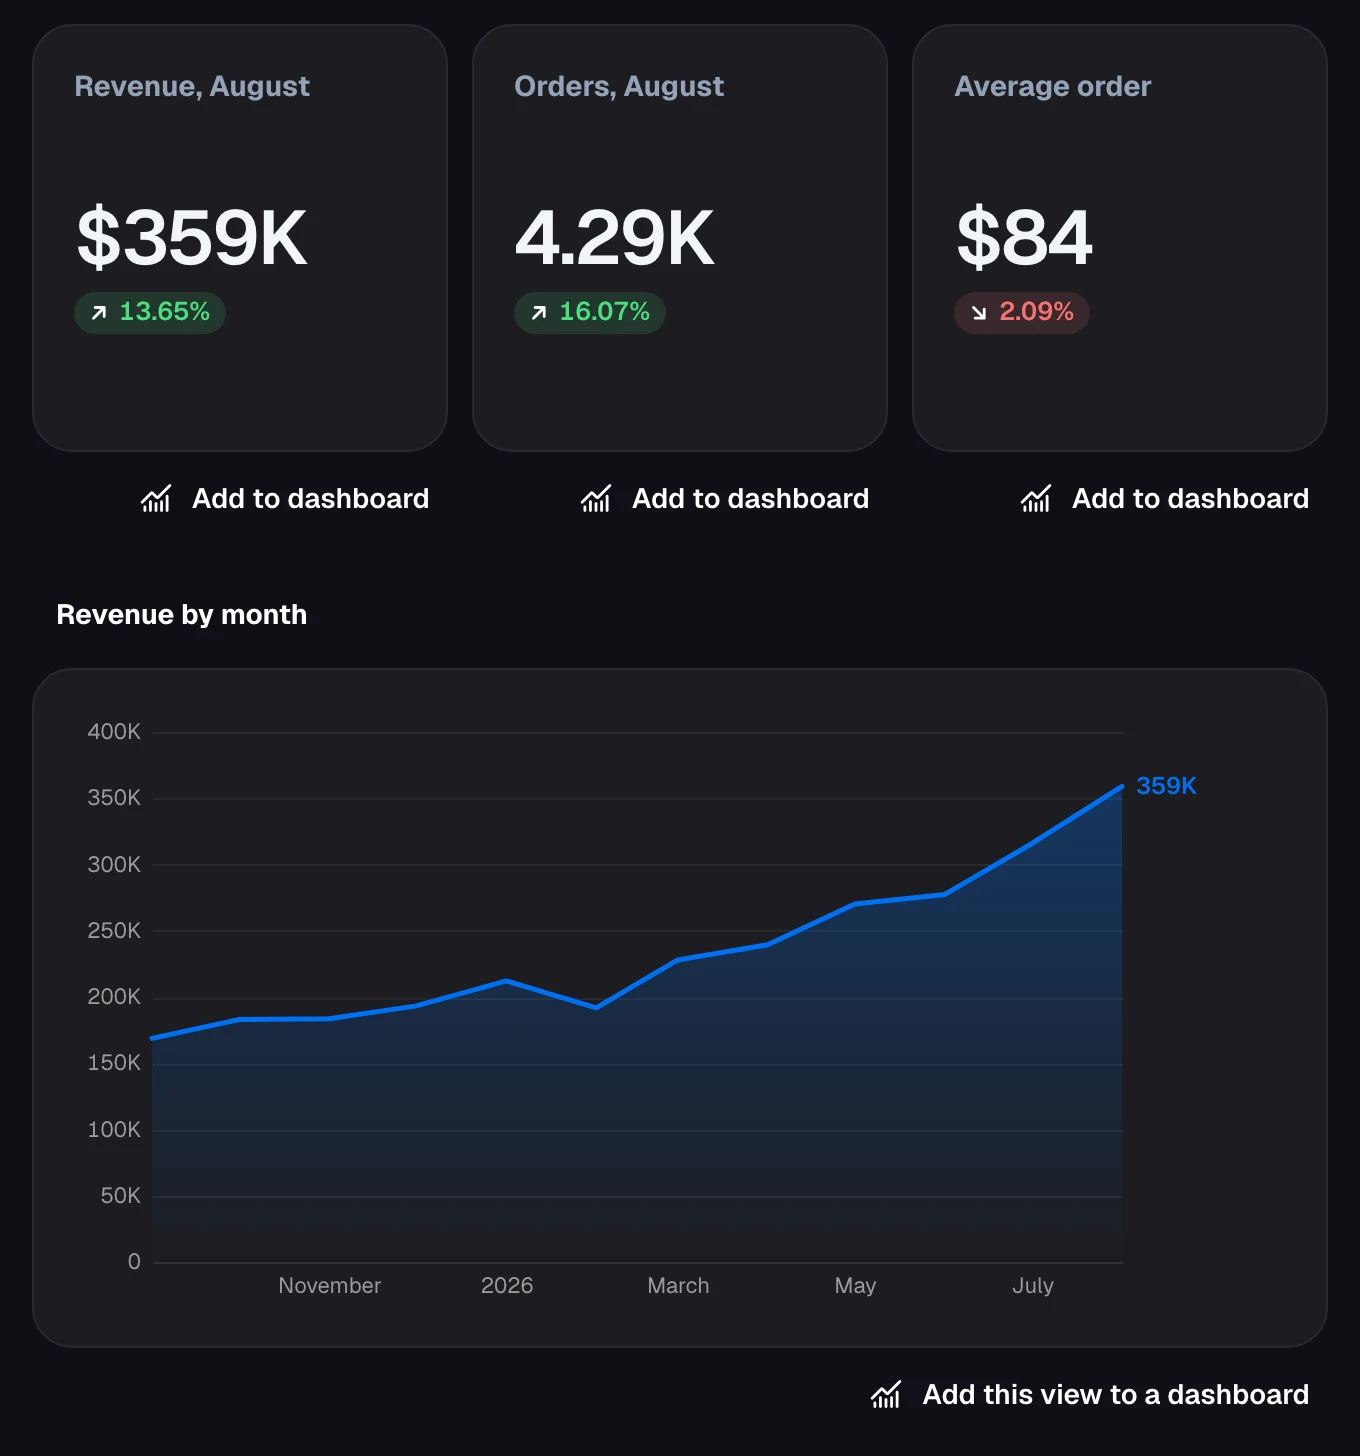
August closed at $359K, up 13.6% on July on 16% more orders, while the average order slipped 2% to $84. Revenue has more than doubled since last September.
The view as Claude draws it, from Google's public e-commerce sample dataset.
- A dashboard, not a snapshot
- A chart in a chat shows the rows it fetched that day. Saved to Dataki, it re-runs its queries, takes a date range and filters, keeps a history of every change and has a link that stays.
- One definition of revenue
- Each source carries the team's business context: metrics as SQL expressions, join paths, columns to avoid, the terms you use. Claude reads it before it writes SQL, and a correction one person makes can be saved, with their OK, for everyone after them.
- Organized by team
- Sources, definitions and dashboards belong to teams, with owners, admins, members and viewers. A dashboard Claude saves is shared with the team whose data it reads, so everyone in it finds it — including whoever joins next month.
06 Inside your own product
Become the analytics layer of your own product.
Embed a live dashboard in your app, your customer portal or an internal tool with a web component that works with any stack, isolates its own styling, and respects dashboard-level permissions.
More on embeddingEmbedding a Dataki dashboard took two tags. Our dashboards now live inside our own product, always up to date, and we never had to build a chart ourselves.
 Jan Mestek Founder
<!-- Load the Dataki embed script once -->
<script type="module" src="https://app.dataki.ai/embed/dataki-embed.es.js"></script>

<!-- Render a dashboard anywhere in your app -->
<dataki-dashboard
  dashboard-id="YOUR_DASHBOARD_ID"
  api-key="YOUR_EMBED_API_KEY"
  theme="dark">
</dataki-dashboard>Dataki helps us stay in flow — we can analyze our databases, create dashboards, and share them with the team
 Tobias Klimpel CEO & Co-founder


Connect a source → Dataki writes and runs the SQL → a live dashboard
Reads BigQuery, PostgreSQL, MySQL, Amazon Redshift, Supabase and Google Sheets directly, and uploaded CSV and Excel files.
You pay for governed data, not for seats
Anyone can view a Dataki dashboard for free, and everyone on your team can build one. You pay for the questions you ask, not for the people who might ask them.
Beta Every plan is free while Dataki is in beta
No card, no trial clock. These are the prices we intend to charge, published early so nothing about them is a surprise later. When billing starts you get 30 days' notice by email, and whatever you have built keeps working.
Free
forever
$0 during beta
Connect Dataki to Claude, Cursor or ChatGPT and keep what it builds.
-
 One data source
 - 20 AI messages a month
- Unlimited dashboards, unlimited viewers
- Everyone on your team can use it
- MCP server and scoped API keys for any AI assistant
Team
per month
$0 during beta
For a team that has stopped queueing behind one analyst.
- Three data sources
- 100 AI messages a month
- Unlimited dashboards, unlimited viewers
- Encrypted credentials your agents never see
- Alerts when a number crosses a line
Business
per month
$0 during beta
For the whole company, with the controls an admin will ask for.
- Unlimited data sources
- 600 AI messages a month, then €0.25 each
- Badge-free embedded dashboards
- Audit log of everything an agent ran
- Single sign-on with Microsoft Entra ID
Platform
priced per app and volume
$0 during beta
Embed Dataki in your own product. Priced per app and end-user volume.
- Everything in Business, at Business rates
- Embed Dataki in one product, for 25 of your customers a month
- Each of your customers sees only their own rows
- Your branding, themed per customer
- Self-hosting and dedicated support
An AI message is one question you ask Dataki, however many queries it takes to answer. Reading a dashboard, refreshing it, sharing it with anyone, or adding someone to your team is never a message, and never counted.
Team stops at 100 messages a month. On Business, messages past 600 are €0.25 each, added to the next invoice. Unused messages do not roll over.
On Platform, one of your customers counts in a month only if a dashboard actually served them data that month. Customers who never open one are never counted.
Already on a per-seat or per-editor plan? It keeps working at the price you signed up for.
Questions people actually ask
The short, checkable answers — the same ones we would give you on a call.
- Can I run queries directly against BigQuery and see the results visualised inline?
- Yes. Dataki connects straight to BigQuery, translates your plain-English question into SQL, runs it against your warehouse, and renders the chart inline next to the answer. You can open the generated SQL for any chart, edit it, and re-run it. The same flow works for PostgreSQL, MySQL, Amazon Redshift, Supabase and Google Sheets.
- Is Dataki a notebook, a BI tool, or something else?
- Dataki sits between the two. Like a notebook, you work by asking one question after another and each answer comes back as a live chart backed by real SQL. Unlike a notebook, the result is not a document you have to re-run — anything worth keeping becomes a dashboard with a permanent link that refreshes on its own and can be shared with people who will never open a query editor.
- Can I connect Claude, Cursor or ChatGPT to my own database?
- Yes. Dataki exposes a remote MCP server, so any assistant that speaks the Model Context Protocol — Claude, Cursor, ChatGPT and others — can list your data sources, run governed queries and create dashboards. The assistant receives query results only; database credentials stay encrypted inside Dataki and are never passed to the model.
- Our team already builds dashboards with Claude. Why would we need Dataki?
- Because a chart an assistant makes in a chat is usually a snapshot of the rows it fetched that day, in one person's history, worked out with that person's idea of what revenue means. Connected to Dataki over MCP, the same assistant saves its answer as a live dashboard: it re-runs its queries, takes a date range and filters, keeps a history of changes and has a link. Each source carries one business context for everyone who queries it — metrics as SQL expressions, join paths, columns to avoid and business terms — which Claude, Cursor and ChatGPT read before they write SQL, and a correction one person makes can be saved, with their OK, for everyone after them. Sources, definitions and dashboards belong to teams with owners, admins, members and viewers, and a dashboard an assistant saves is shared with the team whose data it reads, so it reaches everyone in it, including people who join later.
- Can Claude show Dataki charts inside the conversation?
- Yes. In Claude, and in other hosts that support MCP Apps, Dataki's MCP server answers with an interactive view: charts, tables and headline numbers drawn by the same components as a Dataki dashboard, from the rows the server got by running each query itself, not from numbers the model typed. Every chart is checked against its rows before it is shown, and each carries an Add to dashboard button that saves it as a live widget, on a new dashboard or an existing one. Hosts without MCP Apps get the same answer as text.
- Do I need to know SQL to use Dataki?
- No. You ask in plain English and Dataki writes and runs the SQL for you. The query is always shown, so anyone who does read SQL can check the logic, correct it, or take it away and use it elsewhere — the generated SQL is not hidden or proprietary.
- Which data sources does Dataki support?
- Dataki connects directly to Google BigQuery, PostgreSQL, MySQL, Amazon Redshift, Supabase, Google Sheets and uploaded CSV or Excel files, including hosted databases such as Neon, Amazon RDS, Cloud SQL and PlanetScale. Google Analytics 4, Firebase, Search Console, Firestore and Stripe reach it through their exports to BigQuery, with a setup guide for each route. Every query runs read-only.
- How does Dataki stop an AI agent from doing damage to production data?
- An API key acts as the person who created it and can never reach a source that person could not already open. Keys are scoped by permission, carry daily ceilings on query count and bytes scanned, and can be revoked at any time. Every query is logged with the key that ran it, the SQL, the row count and the duration — failures included.
- Does Dataki support single sign-on (SSO)?
- Yes, with Microsoft Entra ID. People sign in through their company's own Entra tenant, so its password policy, MFA and Conditional Access apply, and they land in their company's Dataki team. A returning person is recognised by the tenant and object IDs in a token the tenant signed, and an email address is trusted only on the domains the team lists. SSO is set up per team: you register Dataki in your Entra directory and we connect it to your team.
- Can I embed Dataki dashboards inside my own product?
- Yes. A <dataki-dashboard> web component renders any dashboard inside your app, portal or internal tool with one line of HTML. It works with any framework, keeps its styling isolated from your site's CSS, and supports per-tenant theming and row-level scoping so each of your customers only sees their own data.
- How much does Dataki cost?
- Dataki is free for everyone while it is in beta — no card, and 30 days' notice by email before billing ever starts. The published plans are Free (one data source, 20 AI messages a month), Team at €99 a month (three sources, 100 messages), Business at €519 a month (unlimited sources, 600 messages, then €0.25 each) and Platform, priced per app and volume, for embedding Dataki in your own product. Plans are priced on data sources and AI messages, never on people: everyone on your team can build, and anyone can view a dashboard for free.
Free while we are in beta
Connect a database. Ask it something.
It takes about five minutes and a read-only connection string. If it cannot answer your first real question, you have lost an afternoon coffee's worth of time and nothing else.
- One data source
- Free tier. Connect a second on any paid plan.
- Unlimited dashboards
- And unlimited people looking at them.
- No card
- There is nothing to cancel if you stop.